Debug CamoFox Browser Workflows with Traces and Console Logs
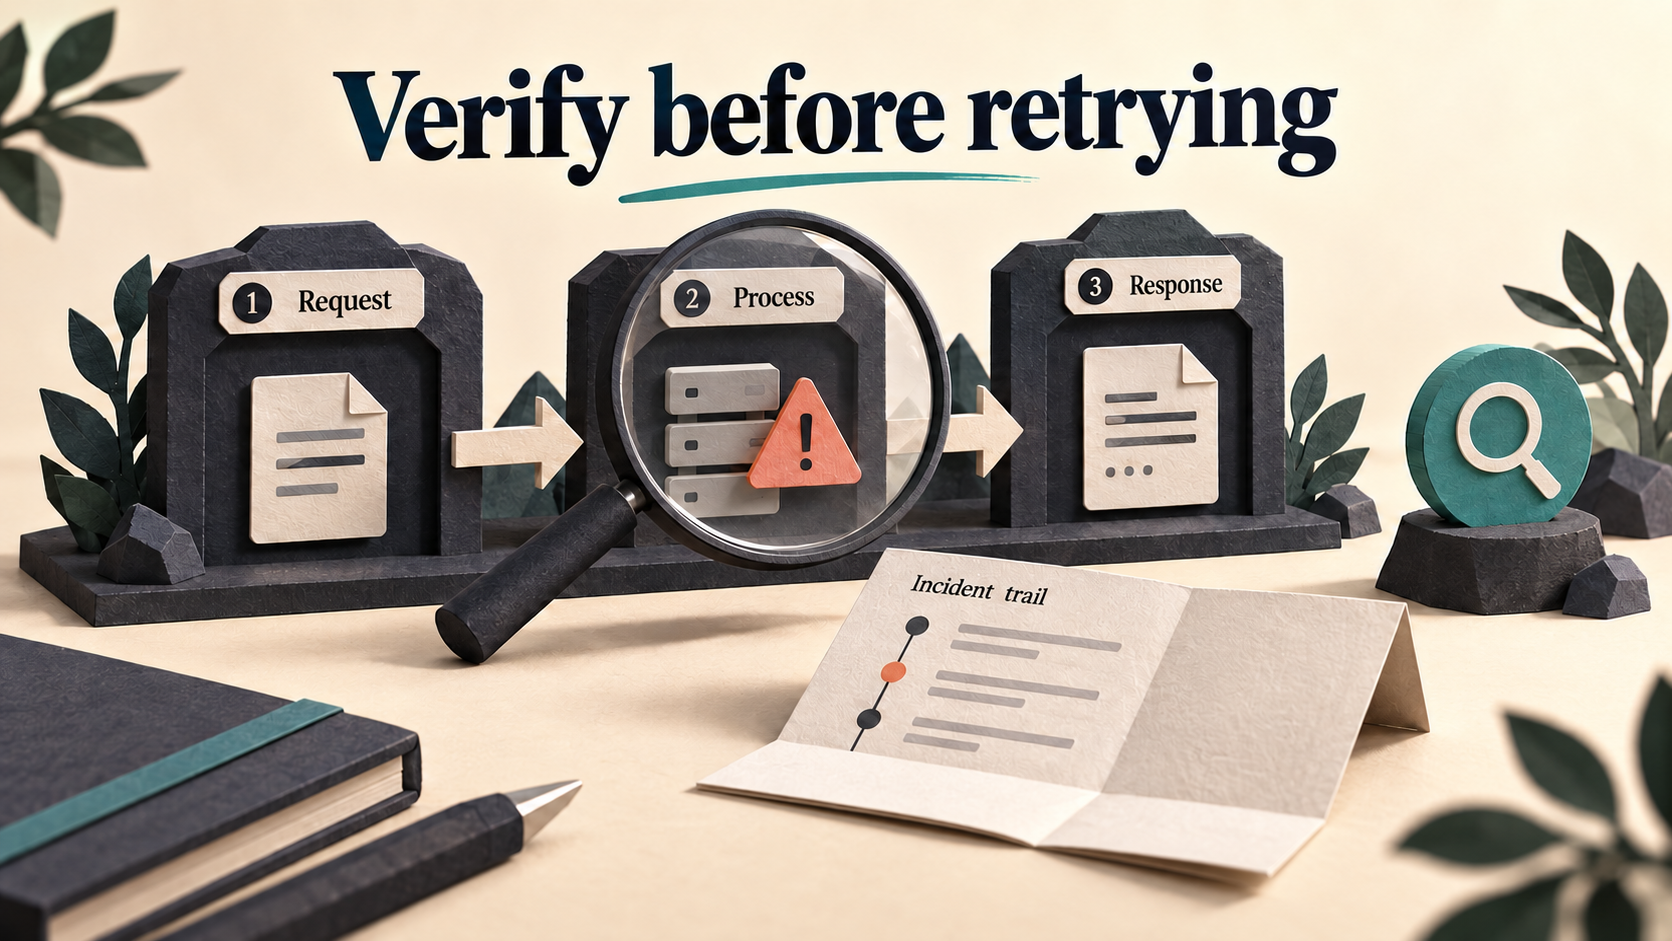
Quick answer: Check the page's actual state before retrying a failed CamoFox task. Preserve the URL, expected result, tab/user identity and available console/errors. If tracing was not enabled when the failure happened, that historical trace is unavailable: reproduce only on a safe authorized fixture or a reversible read-only path. For a new controlled run, record a short trace, inspect the final result and verify cleanup.
A successful API response can mean an action was accepted, not that your business task finished. A screenshot, trace and explicit result check help you tell a broken action from an incomplete observation, a wrong selector or a configuration problem.
Controlled validation: after a separate compatible-engine preflight, we exercised actual console/error capture, CLI trace start/status/stop, ZIP download and a required-selector failure on an owned fixture. The downloaded archive contained action/network evidence and a screencast frame, but no DOM frame-snapshot events despite requesting snapshots. This is scoped diagnostic evidence, not a complete page replay or a browser-recovery guarantee.
First ask: what would count as success?
Write a concrete postcondition before investigating. “The request returned 200” is usually too weak. Better checks are “the intended report heading and period are visible”, “the required name and link were extracted from this page”, or “the owned tab no longer appears under this user”.
Keep three layers distinct:
| Layer | Question | Useful evidence |
|---|---|---|
| Transport/action | Did the correct service accept the request? | Status, endpoint, sanitized request scope and error. |
| Observation | Did we inspect the right page and enough of its current state? | Resolved URL, snapshot, relevant field and screenshot when needed. |
| Task outcome | Did the intended report, extraction or cleanup actually happen? | Explicit postcondition readback, not a confidence statement. |
This is not a guide to every installation problem. If Browser never starts or you are choosing the Windows components, begin with the setup checklist. If your AI client cannot connect to the companion, use the MCP architecture guide.
If the failure already happened without tracing
Do not begin by replaying the action. First preserve whatever exists: current page URL/state, screenshot, console messages, uncaught errors, workflow logs and the exact tab/user identifiers. Record what the task expected and what was actually observed. Do not clear the console or close the evidence-bearing tab before capture unless leaving it open creates a more serious risk.
You cannot create a trace retroactively by starting recording after the failure. Mark the historical trace as unavailable. If further diagnosis requires reproduction, use a dummy fixture or a reversible read-only operation with permission. Do not repeat a payment, submission, message send or delete merely to obtain a better screenshot: the first attempt may already have had its effect.
A real preflight incident: the service answered, but no tab was created
In our first isolated 5 October 2026 attempt, n8n v2.41.6 reached a source-matched CamoFox Browser v2.4.8 (Preview) server using camoufox-js 0.8.5 and downloaded Camoufox 156.0.1 beta.34. The server was reachable and the dedicated-user baseline contained no tabs. The n8n manual trigger executed, then its Create tab HTTP Request node received HTTP 500 with Unknown property navigator.product in config.
| Observed evidence | What it establishes | What it does not establish |
|---|---|---|
| Reachable server and empty owned-user baseline. | The control-plane service answered. | That its Browser/engine combination can create a page. |
| Create-tab response: HTTP 500 and the exact configuration-property error. | The run failed before the intended report navigation. | A portal login failure, expired cookie or confirmed defect in every installation. |
| No returned successful tab, no authenticated report observations. | Later navigation/repeat-run steps were not reached. | That an empty report or a successful session-continuity demo exists. |
| Owned process groups ended and Browser, fixture and broker ports closed. | The failed local attempt was cleaned up. | A successful browser-task cleanup workflow, trace recording or production certification. |
The correct response was to preserve that failed request and the environment versions, stop and investigate the wrapper/engine configuration. No page screenshot or trace was manufactured for a tab that never existed. A later separate fixture environment using official Camoufox 135.0.1 beta.24 passed stock tab creation and enabled the controlled diagnostic run below. No fingerprint properties were removed and no product patch recast the original failed stack as passing. The older engine's age/security was not assessed, so this is not advice to downgrade production. A healthy service or an offline test result is still not task completion.
A short controlled diagnostic run after preflight succeeds
1. Isolate the task and record the baseline
Use a dedicated synthetic page or permitted test environment. Retain the Browser version, chosen userId, sessionKey, returned tabId, expected URL and intended result. Do not debug against someone else's default profile or stop unrelated sessions.
Capture the baseline snapshot and, when useful, a screenshot. A baseline lets you distinguish “the button was never present” from “the button disappeared after an action”. After a navigation or DOM change, obtain a fresh observation instead of assuming old refs still describe the page.
2. Start tracing before the controlled flow
Trace scope is broader than the tab in the command. Browser tracing operates on the browser context and is managed per user. Other tabs in that context can contribute evidence. Use a dedicated diagnostic context and inspect what it contains before recording, rather than assuming a tab ID guarantees a tab-only private recorder.
The Browser tracing documentation supports these CLI operations. Set TAB_ID to your actual owned tab and USER_ID to its user; the placeholders are not captured IDs from the local incident. Configure the approved service address or port for your deployment.
camofox --format json trace start "$TAB_ID" --screenshots --snapshots --user "$USER_ID"
# Perform one short, authorized, controlled browser flow.
camofox --format json trace status "$TAB_ID" --user "$USER_ID"
camofox --format json trace stop "$TAB_ID" --user "$USER_ID"
Stopping returns information about a server-managed trace, including its actual filename. Download that returned filename using the documented GET /sessions/<userId>/traces/<filename> operation and retain the actual bytes privately. Do not guess a name or assume the CLI response itself is a locally downloaded ZIP. Requesting snapshots is not proof that your resulting artifact contains them.
Use the port/service configuration for your approved deployment and the authentication it requires. Explicit identity prevents a command's default context from silently becoming the diagnostic target. Keep the recording short and check its returned state rather than assuming it remained active throughout a long job.
3. Capture console and uncaught errors separately
The console reference distinguishes messages from uncaught JavaScript errors:
camofox console "$TAB_ID" --user "$USER_ID" --format json
camofox errors "$TAB_ID" --user "$USER_ID" --format json
Keep an initial unfiltered capture when appropriate, then filter for the question you are diagnosing. An empty uncaught-error list does not prove the page's data loaded correctly; a site may handle an error or silently show an empty result. Preserve evidence before using any clear operation.
4. Reproduce a harmless, meaningful failure
On a controlled page, change a selector or deliberately delay a required field. Record the difference between expected and observed state. This helps test your diagnostic process without causing a real customer operation.
Do not reproduce a historical bug merely to make the product look broken. The earlier cleanup issue was fixed in Browser v2.4.7. It motivates checking the result; it is not a claim that the same defect exists in the current release.
5. Inspect the final state, not just the action response
After the attempted action, read the resolved URL and relevant page/snapshot again. Check the exact expected field, report state or owned tab. A successful transport response may still accompany a login page, an empty list or a task aimed at the wrong user.
For structured extraction, inspect required-field errors and completeness. For cleanup, list the owned user's tabs and verify the exact target is absent. The documented close operation is idempotent under the specified user scope; a successful close response alone does not prove you supplied the right user or closed the real target.
6. Stop and inspect the trace artifact
Stop the trace and preserve the actual ZIP returned by the operation. Confirm that it is readable and contains the useful action sequence for your run. A file extension or successful download response does not establish that the relevant failure was recorded.
The Browser API also documents managed trace listing, download and deletion per user. Use the actual returned artifact name, not a filename inferred from an example. A Playwright trace is not automatically equivalent to the requested session-wide recording/HAR feature in MCP; that request must remain a request.
REST endpoints for an existing orchestration workflow
If your workflow uses REST instead of the CLI, the Browser endpoint reference documents the corresponding operations. Keep the same owned tab/user and configure required API authentication.
| Operation | Endpoint | Identity/payload |
|---|---|---|
| Start trace | POST /tabs/<tabId>/trace/start | JSON body includes userId. |
| Check recording | GET /tabs/<tabId>/trace/status | Query includes userId. |
| Stop/save trace | POST /tabs/<tabId>/trace/stop | JSON body includes userId; retain returned artifact information. |
| Read console/errors | GET /tabs/<tabId>/console and /errors | Query includes userId. |
| Capture screenshot | GET /tabs/<tabId>/screenshot | Query includes userId; preserve actual PNG bytes. |
| List/download managed traces | GET /sessions/<userId>/traces and /traces/<filename> | Use the owned user and actual returned filename. |
| Close/read back tab | DELETE /tabs/<tabId>, then GET /tabs?userId=… | Delete JSON body includes userId; verify the owned target is absent. |
Choose the next action from the evidence
What the controlled trace proved—and did not
The later fixture run recorded a real required-selector error at data.price. Correcting the authorized schema mapping yielded the expected two product records. The rendered page had not changed: the failure and final screenshots were byte-identical. That is evidence of an extraction-mapping correction, not a browser restart, stale-ref repair or visual recovery.
The real downloaded ZIP passed CRC inspection and contained six members, including action logs, local fixture network resources and a screencast frame. Inspection counted 70 before action events and zero frame-snapshot events. Its catalog HTML/JSON resources matched the original fixture. We did not verify the Trace Viewer interface, HAR export or a complete DOM replay. Keep the archive's observed contents separate from the options you requested.
Actual console and uncaught-error captures were preserved separately. Managed-trace deletion was checked by listing the owned user's artifacts again, and the final owned-tab list was empty. This cleanup belongs to the controlled test; it is not proof that an arbitrary failing workflow or a consequential retry is safe.
| Evidence | Likely diagnostic direction, not a diagnosis by itself | Next safe step |
|---|---|---|
| No service response. | Listener, routing or API configuration. | Check the approved service path before more browser actions. |
| Page is a login/denial screen. | Portal authentication, authorization or target policy. | Stop for authorized access; no bypass. |
| Expected selector absent after page change. | Stale observation, changed markup or delayed content. | Inspect fresh scoped DOM/state; one bounded read-only recovery if justified. |
| Console contains a relevant script/data error. | Page runtime failure. | Preserve the error and correlate it with the visible state/time. |
| Transport succeeded but required result is wrong. | Observation, target or workflow assumption. | Compare the postcondition with the actual page/output; do not label success. |
| Owned tab remains after cleanup. | Wrong scope or a cleanup failure. | Verify identifiers and close only the owned target; preserve failure if unresolved. |
Evidence may support a retry for transient read-only loading. It may instead require a selector change, credential review or explicit stop. Do not turn every error into an automatic retry loop.
Keep a useful, sanitized incident pack
Traces, screenshots and console logs can contain DOM text, network payloads or account data. Restrict access and retention, create a redacted public derivative when needed, and inspect that derivative before sharing. Do not upload a private artifact to a new viewer/service merely because the documentation links a viewer. Use a locally approved review path where sensitive data is involved.
Your next useful test
The diagnostic operations here belong to CamoFox Browser. Inspect its documented trace/console path rather than assuming every MCP client supplies the same artifact tools.
Capture one short authorized diagnostic run, then verify its final state. If the original failure was not recorded, preserve what exists and choose a safe reproduction rather than replaying a consequential action. If ordinary Playwright tracing already fits your test stack, it remains a valid alternative.
Method and scope
Auto-Bot.io publishes this runbook for redf0x1/camofox-browser. The executed synthetic Browser REST/CLI checks used unpatched v2.4.8 (Preview), commit 4f23dcf30dc0a1fb20b1a94fd6035a000a31a8bd, camoufox-js 0.8.5, Node 22.22.2 and isolated official Camoufox 135.0.1 beta.24. No live accounts or commercial pages were provided. The engine's age/security was unassessed; this is not a production compatibility or security certificate.
The earlier beta.34 preflight failure remains a dated negative case. The later trace evidence does not establish MCP tracing, session-wide HAR, captured DOM snapshots, Trace Viewer rendering, crash/restart recovery or automatic repair. Browser, its underlying engine and the separate MCP companion remain distinct. The hero and blank incident template are not captured product evidence; actual traces can retain page data and stay private until their sharing scope and redaction are verified.
Inspect the Failure Before Retrying
Review the current Browser diagnostics, preserve existing evidence and confirm the expected outcome before a safe reproduction.
A trace without DOM snapshots is not full page replay